

tl;dr: At 31% of the budget, Somerville spends more on schools than anything else.
The Fiscal Year 2027 (FY27) budget for Somerville, MA was adopted in June of 2026, and took effect July 1.
Mayor Wilson submitted his budget on June 4, and the City Council approved the budget on Thursday, June 25. It totals $394.2 million, a 3.3% increase1 over the FY26 budget of $380.1 million.
The Shape of the Budget
Everything below is derived from a single source: the table “Non-School Expenditures by Prime Account”2 in Section 1.3 of the FY27 budget book on the city’s ClearGov portal.
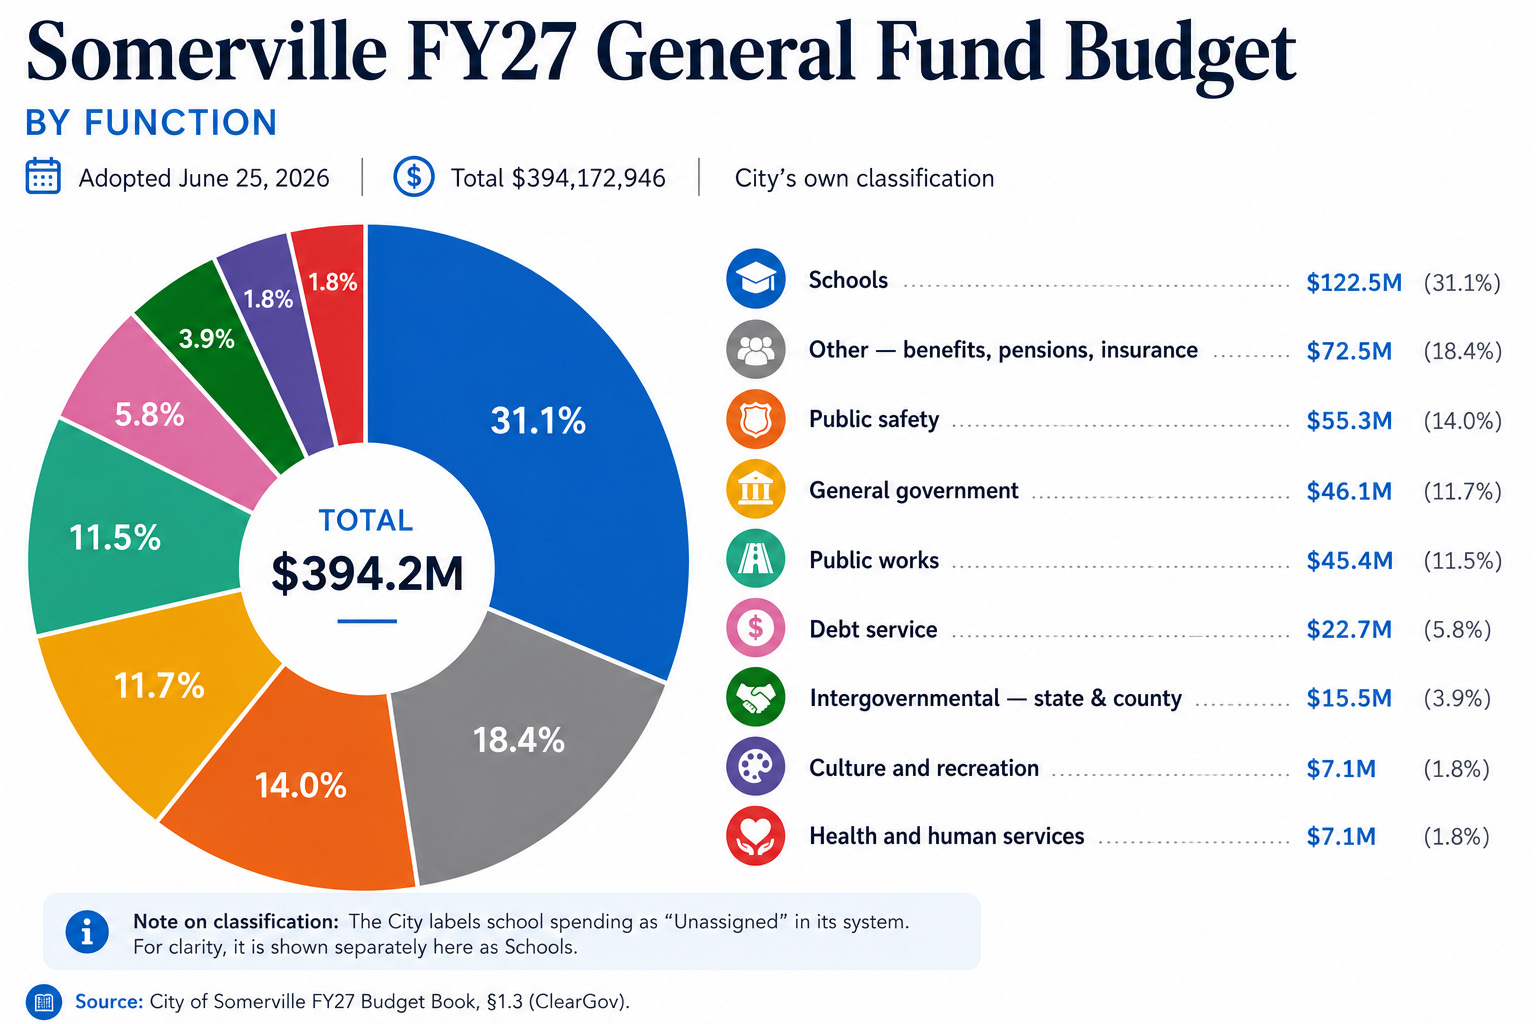
This is the city’s own classification of expenses, and notably, it involves some surprises. For example, reporting schools at 31.1% of the budget could be seen as a slight undercount, because school employees’ health insurance and the school custodians’ payroll sit outside it. More on this below.
Let’s take a look at the budget by function.
Schools — $122.5 million, 31.1%
The largest function is the school budget3 at $122.5 million, 31.1% of the total budget.
This function covers teachers, administrators, school building operations, and the district’s own programs. As previously mentioned, it does not cover health insurance for school employees, which is inside “Other,” and the school custodians, listed as a Public Works line at $4.8 million.
So the true cost of running the schools is meaningfully higher than 31.1%, perhaps closer to 37% once school employees’ health insurance and custodians are counted, and this is still not counting pensions and payroll taxes.
Other — $72,491,906 (18.4%)
Somerville’s second-largest budget function is the pooled cost of employing people (things like insurance, pensions, and payroll taxes) charged centrally rather than to each department.
Health and life insurance alone is $39.4 million. The consequence is that every other slice of the pie understates what that function actually costs: a firefighter’s salary is in public safety, but their health insurance is in “Other”.
This bucket also contains a $3.1 million contingency account, money set aside for union contracts still being negotiated, and $4.0 million in a line the table labels simply “Capital”.
Public safety — $55,349,268 (14.0%)
Did you know that Somerville spends more on Fire than on Police? I sure didn’t. Fire is the largest public safety department at $26.6 million, slightly ahead of Police at $23.2 million.
Parking regulation and enforcement is also in this function, at $5.3 million, counted as part of public safety rather than public works or revenue.
General government — $46,120,956 (11.7%)
The catch-all for running the city as an institution. It holds the mayor’s office and City Council, the Clerk and Elections, Law, People Operations and the whole finance apparatus.
Technology & Innovation is the largest single line at $7.1 million. This covers a small staff managing a contract and licensing budget of $5.7 million — mostly acquiring, implementing, and maintaining the hardware and software that City operations depend on. For a city with around 1,000 employees across dozens of buildings, that’s roughly $5,700 per employee per year in systems and licensing, high but not unusual for municipal IT.
This function also holds a substantial policy operation that a reader might not think of as “government overhead”: planning, housing, housing stability, economic development and mobility together come to $7.8 million, slightly more than the city spends on technology. Inspectional Services, which handles permitting and building code, is $3.6 million.
Public works — $45,416,108 (11.5%)
Facilities is the largest public works expense at $13.9 million, largely the ordinary maintenance costs of heating, lighting and maintaining municipal buildings. Trash and recycling is the next largest single service at $9.8 million, then streets & sidewalks at $5.3 million, then school custodians at $4.8 million. Snow removal alone for FY27 is budgeted at $1.8 million.
Debt service — $22,698,770 (5.8%)
Principal and interest on money already borrowed. This is the least discretionary and therefore least interesting line in the budget: it reflects past borrowing decisions and can’t be reduced without defaulting. It rose only $91,240 over FY26, or 0.4%, essentially flat.
Intergovernmental — $15,509,305 (3.9%)
This is money Somerville collects but doesn’t control, assessments charged by the state and county that pass through the city’s budget.
Culture and recreation — $7,059,731 (1.8%)
Only two line items, and almost entirely libraries. The library system is at $4.6 million, nearly twice Recreation at $2.5 million. Together they account for less than two cents of every budget dollar, less than the city spends on recycling and waste.
Health & human services — $7,050,892 (1.8%)
The smallest function in the budget, and the one that changed most in FY27. Aside from the Council on Aging, every unit in this function either did not exist under its current name in FY26 or was radically resized.
The largest line items are Community Wellness at $1.6 million and Public Health at $1.4 million.
Community Wellness is brand new in FY27, created as part of a city-wide re-organization. The mission statement is “To work together and with the community to build a foundation of health, so every person in Somerville can thrive.” From the budget book, we see that its purview includes youth services, farmers’ markets, and prevention services.
Changes from FY26
Massachusetts requires a balanced budget: appropriations can’t exceed estimated revenue.
City officials entered the budget process facing a projected $5.4 million shortfall driven by slowing revenue growth, rising fixed costs, and pressure on the commercial real estate market. According to the budget document, the administration balanced the budget by reducing non-personnel spending by approximately 5 percent, reorganizing city departments, strategically using reserve funds, and reducing staffing while maintaining core services. The adopted budget reflects a net reduction of 23.1 full-time equivalent positions compared to FY26.
Overall, the budget increased from last year’s by $14.1 million. Of that, the largest change was the increase in the school budget of $8.2 million. In comparison, the non-school budget increased only $5.9 million.
Primary Sources
FY27 Digital Budget Book — The full budget on the city’s ClearGov portal.
somervillema.gov/budget — The landing page.
somervillema.legistar.com — Hearing agendas, minutes, and recordings from the June sessions
Mayor’s presentation announcement (June 4) and approval announcement (June 29)
The city states that the FY27 budget is a 3.3% increase over the prior year, but the figures above indicate an increase of 3.7%, and we can’t reproduce 3.3% from any pair of published figures. One explanation might be that this was calculated from the approved FY26 budget, plus the $1.5 million union contract contingency the Ballantyne administration said it would add to the school budget after negotiations concluded. If FY26 was amended upward by that amount mid-year, the revised base becomes $381,576,063 and the FY27 increase computes to 3.3013%.
The table divides the budget into five prime accounts (personal services, ordinary maintenance, capital outlay, special items, other expense) which cut the budget by type of spending, like “capital outlay”. But we’re interested in dividing it by function, which cuts the budget by purpose. A function is a section of government spending like “public safety” or “schools”, and those are the categories most of us are interested in.
The table itself doesn’t say which function a line item belongs to, so for each function, line items were grouped by name and the group was tested against the city’s published function total. A single department can appear in up to three prime accounts, and its function total is the sum across all of them.
This table lists 75 line items totalling $271,696,937. The city’s function chart shows nine functions totaling $394,153,320 ($19,626 below the adopted total for some reason), of which $122,456,384 is the schools (“Unassigned”). The eight non-school functions therefore come to $271,696,936 — one dollar away from the table’s total. This closure shows that the table contains all the money in those eight functions and nothing extra. The stray dollar recurs throughout and appears to be a rounding error in the city’s own table.
The city labels this function as “Unassigned” rather than “Schools”, and the page notes this explicitly, saying, “Please note that due to separate accounting systems, unassigned expenditures represent the Somerville Public Schools Budget.” This is an accounting artifact: Somerville Public Schools runs on a separate accounting system, so it doesn’t break out into expense categories like everything else.